Overview
DXChrono can connect to DX clusters, logbooks, contest software, and propagation services. If you bought DXChrono, the app checks your license online when you activate or validate your key. Each integration is configured in Settings and can show data on the map and in widgets.
Integration prerequisites checklist
- License key – If you bought DXChrono, you need a valid license key (see License below). You enter and save the key in the app; you do not set any license server address in Settings.
- Station callsign set – Required for correct filtering (especially PSK Reporter).
- Internet access – Required for license checks, DX Cluster, PSK Reporter, Cloudlog (unless self-hosted on local network), QRZ Logbook API, optional QRZ XML lookups, TLE/propagation data, and (if you leave it enabled) the optional software update check to desktop.dxchrono.com.
- N1MM running – Required for N1MM integration; Broadcast Data must be enabled to the configured UDP port.
- Firewall rules – Allow required outbound/inbound traffic for configured hosts and ports.
License (when you bought DXChrono)
The app uses HTTPS to talk to the license service when you Activate or Validate. Each successful activation on a new computer counts as one of the PCs allowed on your key (usually up to five).
First run (no license key yet)
If you have not saved a license key yet, the app opens a dedicated DXChrono license dialog before the main window: paste the key from your purchase email, optionally click Activate to register this computer, then click Continue to save. You cannot close this dialog without saving a key (close the whole app from the window if you need to exit).
Later: Settings → License
Press S and open the License tab to change the stored key, turn Validate license when app starts on or off, or use Activate / Validate again. Activate registers this PC with the license service (running it again on the same computer is safe). Validate checks the key without using an extra computer slot. Most keys allow up to five computers; the service enforces that limit.
DX Cluster
Connect to any telnet DX cluster (e.g. DX Spider, AR Cluster, CC Cluster) to see live spots on the map and in the DX Cluster widget.
- Open Settings (S) → DX Cluster tab.
- Add your first cluster profile under the list: name, host (e.g. dxc.ve7cc.net), port (e.g. 7300), login callsign, and cluster type (DX Spider, AR Cluster, or CC Cluster) if needed, then Add or Update. Use Set primary on the node you want as the main connection.
- For a backup cluster, click New profile, fill in the second host, and click Add. If the primary cannot connect, DXChrono tries the others in list order.
- Enable the DX Cluster widget in the Widgets tab if you want the spots list.
- Select a profile, click Test to verify that endpoint, then Save.
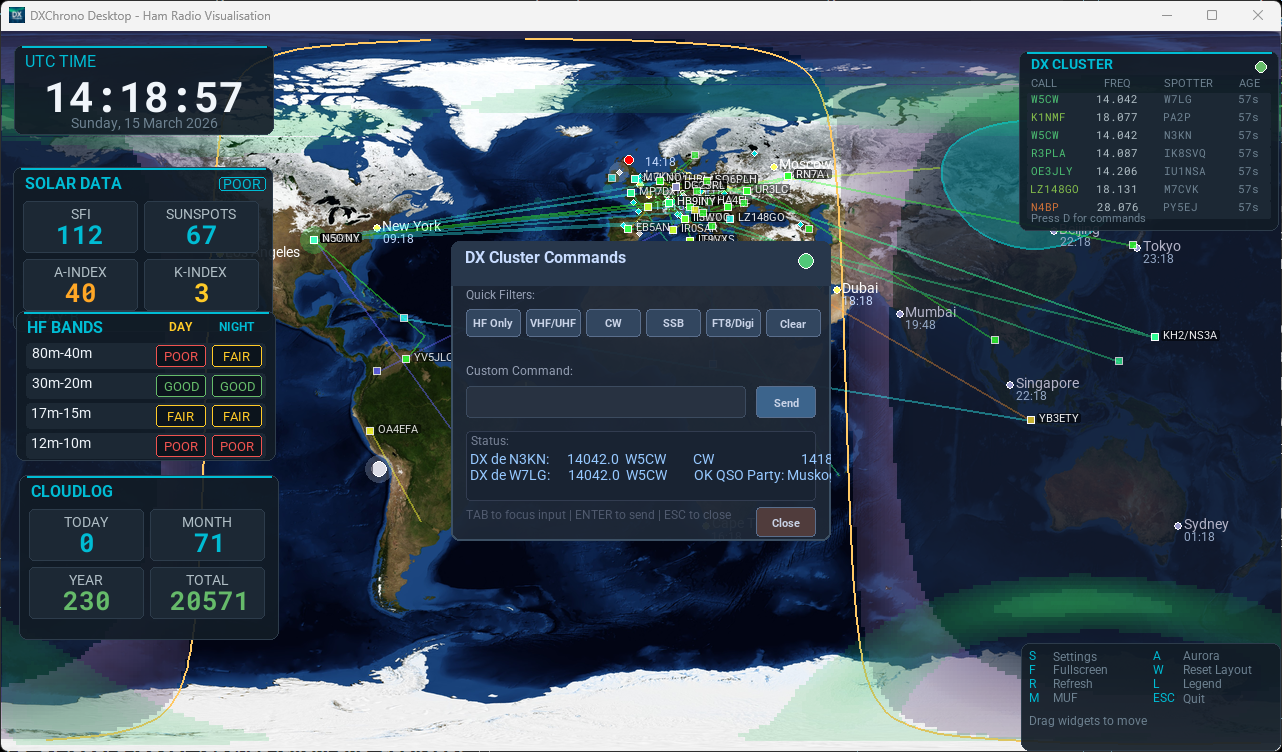
Press D to open the DX Cluster command window and send filter commands (e.g. sh/dx 20). The title area shows which profile is connected (e.g. Connected to VE7CC (dxc.ve7cc.net)) or the current connect/failover status while the link is still coming up. Spots appear on the map with optional labels, great-circle propagation lines, and trail; hover for callsign, frequency, and comment. The DX Cluster widget lists recent spots and shows connection progress when the table is empty—see Map & Widgets → DX Cluster.
Satellite tracking
Show amateur satellites (e.g. ISS, AO-73) and their visibility footprints on the map.
- Open Settings (S) → Sats (Satellites) tab.
- Enable Enable Satellites and optionally Show Footprints / Show Sat Labels.
- Set Footprint Min Elev to tune how large footprints appear (for example, 5 degrees for practical handheld visibility).
- Select which satellites to track from the list (loaded from the TLE URL, e.g. tle.oscarwatch.org).
- Click Save.
Press T to toggle the satellite overlay on or off.
The optional Upcoming Passes widget uses the same selected-satellite list and your station location to predict upcoming AOS/LOS windows. You can choose UTC or local times and adjust prediction lookahead in Settings → Sats.
Contest Calendar (WA7BNM RSS)
Show upcoming contest activity from the WA7BNM contest calendar RSS feed in an optional widget.
- Open Settings → Widgets and enable Contest Calendar.
- Open Settings → Contest Calendar to set the RSS refresh interval, lookahead days, and optionally a custom feed URL.
- Adjust widget font and meta font sizes on the Contest Calendar tab if needed, then Save.
When data is fresh, the widget header shows the update time. If a refresh fails, DXChrono keeps the last successful data and marks it as stale so the list remains usable.
Cloudlog
Display QSO statistics and recent contacts from your Cloudlog instance.
- Open Settings → Cloudlog tab.
- Enter your Cloudlog URL (e.g. https://log.example.com).
- Enter your API key (Cloudlog: Admin → API Keys).
- Optionally enter your Public slug for recent QSOs.
- Click Test, enable the Cloudlog widget in Widgets, then Save.
Recent QSOs can be shown on the map with optional lines to your QTH. Cloudlog data is also used for Special Event mode (last worked, contacts today).
ADIF Logbook file
Use a local .adi file as your logbook source for DXChrono map markers and a dedicated ADIF Logbook stats/recent panel.
- Open Settings → ADIF tab.
- Enable Enable ADIF Logbook file.
- Set the full path to your logger-exported ADIF file (for example a file updated by your logging software while operating), or use the Browse button in the ADIF tab.
- Set Plot most recent and map options (show on map, labels, lines).
- Set refresh interval under Settings → Data → ADIF Logbook (sec), then Save.
DXChrono reads the file carefully to avoid parse errors while the logger is writing it. If your logger rotates to a new ADIF filename, update the path in Settings.
QRZ Logbook
Show recent QSOs from your QRZ.com logbook on the world map (square markers; optional labels and propagation lines). There is no separate QRZ stats widget—only map display.
- Open Settings → QRZ tab.
- Enter your QRZ Logbook access key (see QRZ’s Logbook API documentation).
- Enable Enable QRZ Logbook and Show QSOs on map as needed.
- Adjust FETCH date span, FETCH max records, and Plot most recent to tune how much log data is requested and how many QSOs are drawn.
- Set the refresh interval under Settings → Data → QRZ Logbook (seconds).
- Click Logbook (STATUS) to verify the key, then Save.
Map positions use gridsquare or ADIF lat/lon when QRZ includes them in the export. For setup detail and terminal debug options, see Settings → QRZ Logbook.
XML lookups (optional): on the same Settings tab you can add your QRZ website login and turn on XML geocoding for DX Cluster and/or Reverse Beacon. The prefix table is used first; QRZ fills missing pins, and when QRZ returns a gridsquare the map uses that for a finer position. If QRZ is slow or fails, the prefix result stays. Use the footer XML button to confirm login. This uses QRZ’s XML API and your subscription limits—not the Logbook access key.
N1MM+ UDP
When running alongside N1MM Logger+, DXChrono can show contest/station context, radio band/frequency/mode, and recent QSOs on the map and in an N1MM widget. No Cloudlog required.
- Open Settings → N1MM tab.
- Enable Enable N1MM+ UDP, set UDP Port (default 12060) and Listen Address (e.g. 0.0.0.0).
- Enable N1MM Status Panel and N1MM QSO List in the N1MM tab.
- In N1MM: Config → Config Ports → ensure Broadcast Data is sent to the same port.
- Save.
PSK Reporter
Show who’s hearing you and who you’re receiving via MQTT. Spots appear on the map; hover for tooltip (callsign, frequency, mode, report). The optional PSK Reporter widget lists the same feeds in a table with an SNR bar per row; see Map & Widgets → PSK Reporter.
- Open Settings → PSK Reporter tab.
- Enable and set Host (e.g. mqtt.pskreporter.info), Port (1883), and optionally Use TLS.
- Choose Show Spot Labels, Show Prop Lines, Show Spot Trail, timeout, and max spots.
- Your callsign (from Station) is used to filter spots. Save.
Reverse Beacon Network
The Reverse Beacon Network publishes automated skimmer spots over telnet. DXChrono connects to telnet.reversebeacon.net (CW/RTTY on port 7000, digital on 7001), filters spots to your Station callsign (or an optional RBN callsign override for testing), and shows each skimmer on the map with a great-circle line from your QTH. The optional widget lists skimmer, frequency, mode, an SNR bar, and age.
- Open Settings → Reverse Beacon Network tab.
- Optionally set RBN call (optional) to log in and filter spots as that call (leave blank to use Station). Map lines still use your Station location.
- Enable, choose feeds (CW/RTTY and/or FT8), and map options (labels, lines, trail) like other live spot sources.
- Enable Reverse Beacon Network status panel on the Widgets tab if you want the table on screen. Save.
Special Event Station mode
For event stations, club open days, or visitor displays: scrolling “Last worked” banner, event branding, contacts today, distance, and map legend. You can use Cloudlog or N1MM+ as the data source. See the dedicated Special Event Station Mode page for setup, screenshots, and all options.
Privacy and network notes
- License – Sends HTTPS requests to the DXChrono license service when you use Activate or Validate, and optionally on startup when “validate when app starts” is enabled.
- DX Cluster – Connects to the configured telnet cluster server and receives spot traffic.
- Cloudlog – Calls your configured Cloudlog API endpoints for stats/QSO data.
- QRZ Logbook – Sends HTTPS POST requests to QRZ’s Logbook API (FETCH / STATUS) with your access key.
- QRZ XML (optional) – When enabled for DX Cluster or Reverse Beacon, sends HTTPS GET requests to
xmldata.qrz.comwith your QRZ login to resolve callsigns the prefix table cannot place. - ADIF Logbook file – Reads a local ADIF file from disk on your refresh interval; no cloud/API traffic for this source.
- N1MM+ – Listens locally for UDP broadcast data from N1MM.
- PSK Reporter – Connects to the configured MQTT broker to receive relevant spot traffic for your callsign.
- Reverse Beacon – Opens telnet sessions to the configured RBN host/ports and receives skimmer spot lines (high volume; DXChrono keeps only spots for your callsign).
- Contest Calendar – Fetches the configured RSS feed URL on the refresh interval you set.
- Software update check – If enabled in Settings → Data, DXChrono occasionally fetches a small version file from desktop.dxchrono.com over HTTPS to see whether a newer build is published. No station or license payload is sent with that request. See Settings → Software updates.
If you operate in a restricted network, ask your admin to allow required hosts/ports before setup.