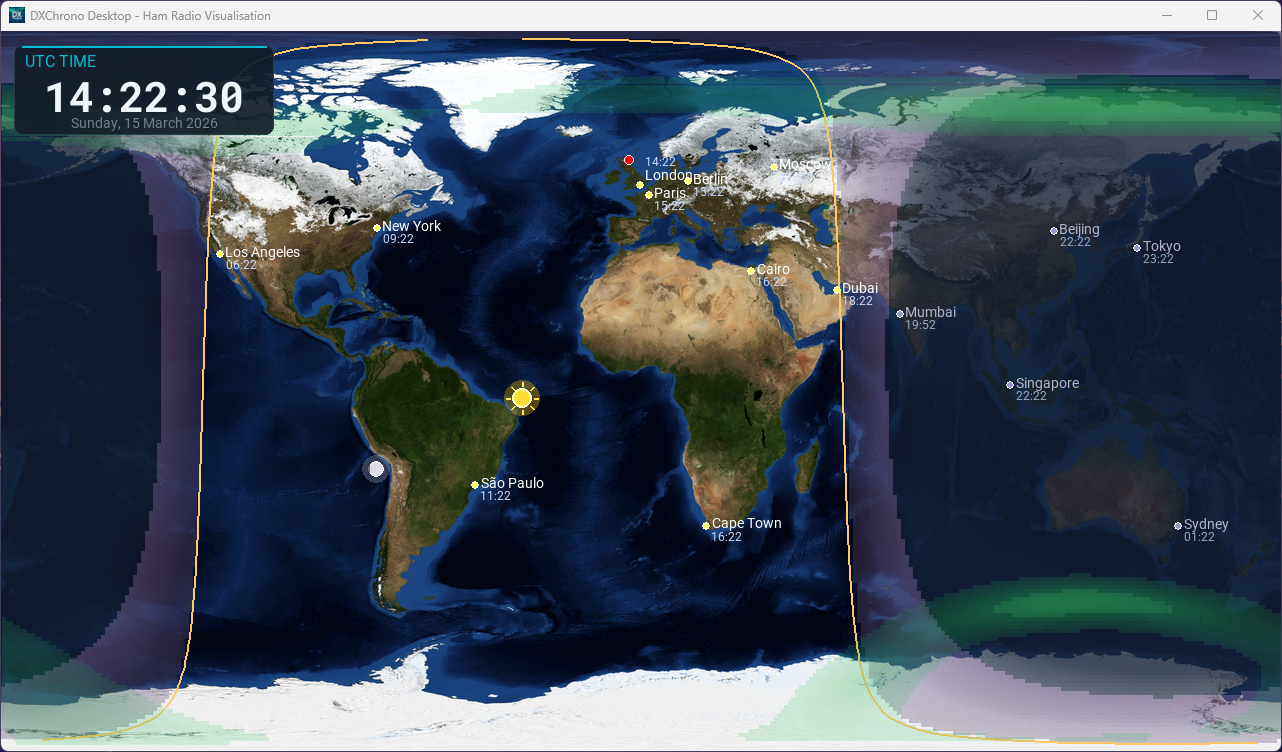
The world map
The main display can run as a flat world map or as an interactive 3D globe (NASA Blue Marble if you ran download_map.py, otherwise a procedural map). In 2D mode, when you zoom in, the app keeps a higher-resolution copy of the rolled map (up to a safe memory cap) and resamples it with smoothing, so coastlines stay sharper than when the map was stretched from the window-sized bitmap alone. Pan and zoom apply only to the map: widgets stay in fixed screen positions. Use the mouse wheel over the map to zoom toward the cursor, left-drag or middle-click drag to pan, or double-click empty map (or press Home) to restore the default full-world view. With no modal dialog open, you can use + / = / PgUp and - / PgDn (and keypad + / -) to zoom, and after zooming in use the arrow keys (and keypad 8462) to pan—held keys repeat. In 3D mode, drag and arrow keys rotate the globe while wheel zoom works the same way. See Controls for details. Gestures are ignored when the cursor is over a widget or a blocking dialog so panels keep normal drag, resize, and scroll behaviour.
It shows:
- Gray line – Day/night terminator with twilight and night-side shading (on the flat map and on the 3D globe), updated periodically. On the globe you also see a subtle terminator line on top of the tint.
- Your QTH – Red marker at your station location (Settings → Station).
- Cities – Selected cities with local time (toggle in Settings → Display).
- Grid / Gridsquares / CQ / ITU – Optional overlays (Settings → Display). Gridsquares show larger 2-character fields first (for example
JO) and switch to 4-character squares (for exampleJO00) only at deeper zoom for readability. - Aurora – Greens and yellows show where NOAA expects aurora activity (Ovation forecast). Press A or turn it on under Display. It stays lined up with the map when you zoom or pan.
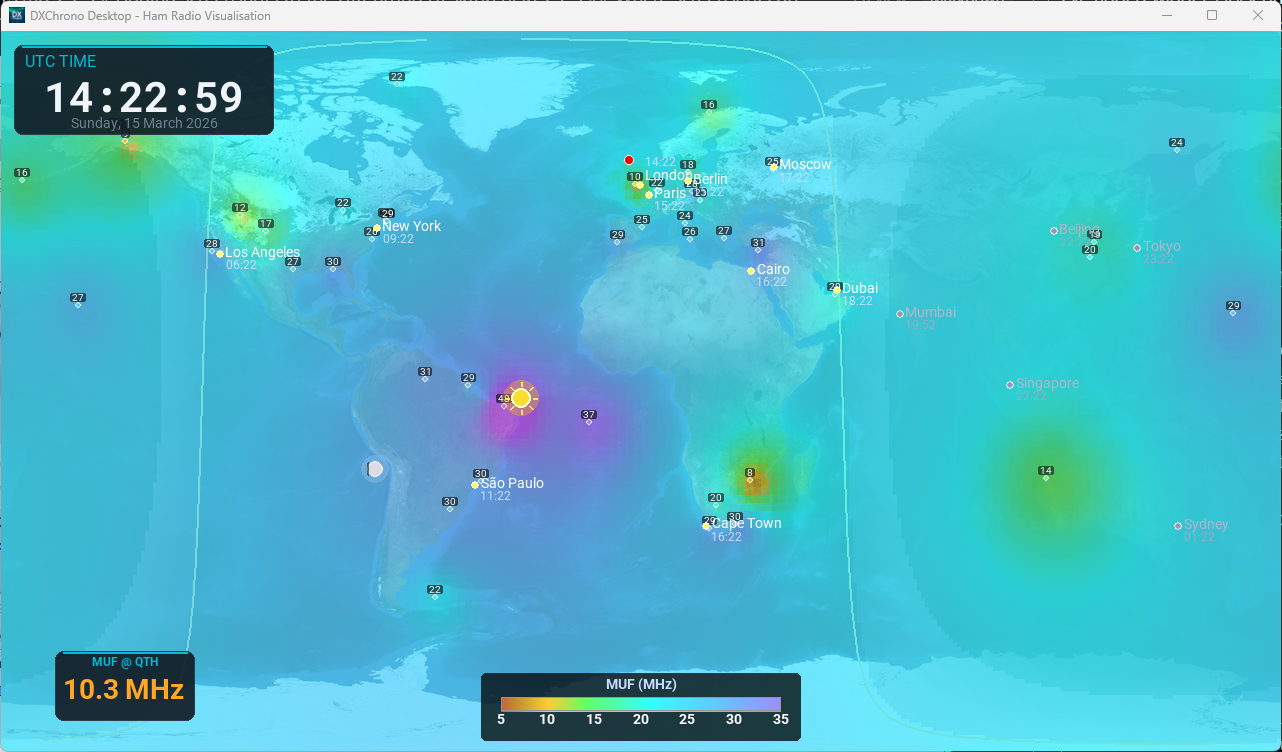
- MUF – Estimated maximum usable frequency by area, with a colour legend. Press M or use Display. It stays lined up with the map when you zoom or pan.
- Satellites – Optional markers and coverage areas for the satellites you track (see Integrations → Satellite tracking). Press T to show or hide them; they stay lined up with the map when you zoom or pan.
- Sun & moon – Positions on the map (optional in Display).
When DX Cluster, Cloudlog, QRZ Logbook, PSK Reporter, Reverse Beacon, or N1MM are enabled, their spots or QSOs appear as markers (and optional great-circle propagation lines). New DX Cluster, PSK Reporter, and Reverse Beacon lines draw in over about two seconds on both 2D and 3D. Cloudlog QSOs use diamond markers; QRZ Logbook uses squares. RBN skimmers use pentagon markers at the skimmer location. Hover over a marker for a tooltip with details. QRZ pins need a gridsquare or coordinates in the returned log data—see Settings → QRZ Logbook.
Map hover now supports both markers and great-circle propagation lines: moving over a line highlights it, and tooltips include the source feed (for example DX Spot, N1MM, PSK Reporter, or Reverse Beacon).
Widgets
Widgets are draggable panels. Drag by the title bar to move them; positions are saved per mode (windowed/fullscreen). Use W to reset all positions to default. Toggle visibility in Settings → Widgets and integration-specific tabs.
Widget behavior notes
- Saved layouts – Widget positions are stored separately for windowed and fullscreen modes.
- Reset key – Press W to clear saved positions and return to defaults.
- DX Cluster widget – The DX Cluster panel supports resize from the lower-left grip and mouse-wheel scrolling through older spots.
- PSK Reporter widget – Same pattern: resize from the lower-left grip; mouse wheel over the panel scrolls the spot list when there are more rows than fit.
- Reverse Beacon Network widget – Same pattern as PSK Reporter: resize grip and wheel scrolling; stacked above the PSK panel when both are visible.
- Upcoming Passes widget – Scrollable and resizable; row font size is configurable in Settings → Sats.
- Upcoming Contests widget – Scrollable and resizable; main and metadata font sizes are configurable in Settings → Contest Calendar. Includes a right-side scrollbar (wheel, track click, and thumb drag).
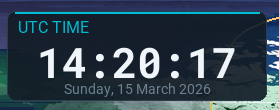
Clock
Large UTC time and date – essential for coordination and logging.
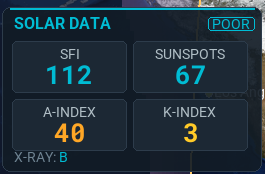
Solar indices
Solar flux (SFI), A-index, K-index, sunspot number, and X-ray from NOAA. Indicates propagation conditions.
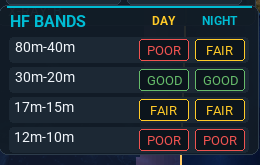
Band conditions
HF bands (80 m–10 m) with day and night status (e.g. Good / Fair / Poor) from HamQSL data.
Sun/Moon Az-El
Optional panel with real-time azimuth (AZ) and elevation (EL) for the Sun and Moon at your QTH. Values are calculated from your station location in Settings → Station (latitude/longitude or grid square).
Station info
Your callsign and grid (or location) for quick reference.
Help / Legend
On-screen shortcut legend. Toggle with L.
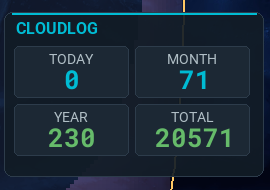
Cloudlog
QSO statistics (today, month, year, total) and recent QSOs when Cloudlog is configured and enabled.
ADIF Logbook
When ADIF file mode is enabled, a dedicated ADIF Logbook widget shows the same style of recent/log summary cards using your local .adi file as the source.
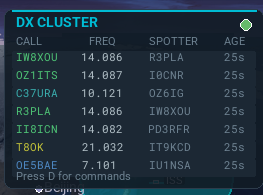
DX Cluster
Live list of DX spots from the connected cluster. Spots can be shown on the map with optional great-circle propagation lines. The title-bar dot is green when connected, orange while connecting, failing over to a backup profile, or waiting to retry, and red when disconnected.
When there are no spots yet (or the link is still coming up), the panel shows a short status line instead of an empty table—for example Connecting to …, Failover: trying …, Logging in to …, or Connected — waiting for spots. With multiple profiles in Settings, failover messages name the profile being tried.
PSK Reporter
When PSK Reporter is enabled in Settings, this panel shows MQTT connection status (indicator dot in the title bar) and a scrollable table of recent spots for your callsign. The title shows HEARD ME or I HEAR depending on the spot list mode you chose in Settings → PSK Reporter.
- Columns – Callsign, frequency, mode, SNR (a compact horizontal bar from the spot’s report field), and age. The bar is a quick visual for signal quality; it does not show a numeric decibel readout in the table. If the widget is too narrow, the SNR column is hidden so call and mode stay readable.
- SNR meaning – For HEARD ME, the bar reflects how the other station reported receiving you. For I HEAR, it reflects the SNR value carried with that spot. If no report is present, the bar stays empty.
- SNR bar colours – The rounded dark grey track is the empty scale (no fill). The coloured fill grows with SNR (roughly −30 dB at the low end to about +6 dB for a full bar; values outside that range are clamped). 0 dB is shown well into the “good” range (not as marginal). Weaker signals use a warmer tint (orange toward red); stronger signals shift to green. Row age still fades the whole row, including the bar.
- Band filter – The cyan note under the section title shows which bands are included (or “All bands”). Filters are set in Settings → PSK Reporter.
- Map tooltips – Hover a PSK Reporter marker on the map for full detail, including decibel values where available.

Enable the panel under Settings → Widgets. Feeds and map behaviour are configured under Settings → PSK Reporter and Integrations → PSK Reporter.
Reverse Beacon Network
When Reverse Beacon Network is enabled in Settings, this panel shows telnet connection status (indicator dot in the title bar) and a scrollable table of recent skimmer spots for your Station callsign (or optional RBN callsign override). Columns are skimmer, frequency, mode, SNR (same bar style as the PSK Reporter widget), and age. Band filtering and font size are under Settings → Reverse Beacon Network.
Enable the panel under Settings → Widgets. Setup and privacy notes are under Integrations → Reverse Beacon Network.
MUF
MUF at-QTH panel shown when MUF overlay is enabled (M).
N1MM status & recent QSOs
When N1MM+ UDP is enabled: contest/station and radio context, plus a list of recent QSOs. Recent N1MM QSOs also appear on the map.
Upcoming Passes
Scrollable list of predicted satellite passes from your selected satellites and station location. Shows AOS/LOS, MAX as peak elevation in degrees, TRK as three compass points for the pass arc at AOS, peak, and LOS (for example W-N-E), and live ETA/countdown. Active passes are highlighted for the full pass duration.
Upcoming Contests
Scrollable WA7BNM contest schedule panel sourced from the contestcalendar RSS feed. Rows show contest name, time window, and live status/countdown. In-progress contests are highlighted. Countdowns are shown in days/hours/minutes for longer windows. If feed refresh fails temporarily, last good data is kept and marked as stale.
Special event
When Special Event mode is on: event name and dates, scrolling “Last worked” banner, contacts today, distance to last QSO, and optional legend.